
How to build a KPI dashboard using Claude Code and AI agents
A friend of mine runs a mid-size e-commerce company. She had revenue data in Shopify, ad spend in Google Ads, customer support metrics in Zendesk, and employee productivity numbers in a dozen spreadsheets. Every Monday morning, her ops manager spent three hours pulling numbers from six different platforms just to answer one question. "How did we do last week?"
That's a broken system. And it's shockingly common.
This guide walks you through building a unified KPI dashboard from scratch using Claude Code on your Mac. We'll use AI agents to do most of the heavy lifting. You don't need to be a developer. You just need to be willing to follow along and type some commands.
What we're actually building
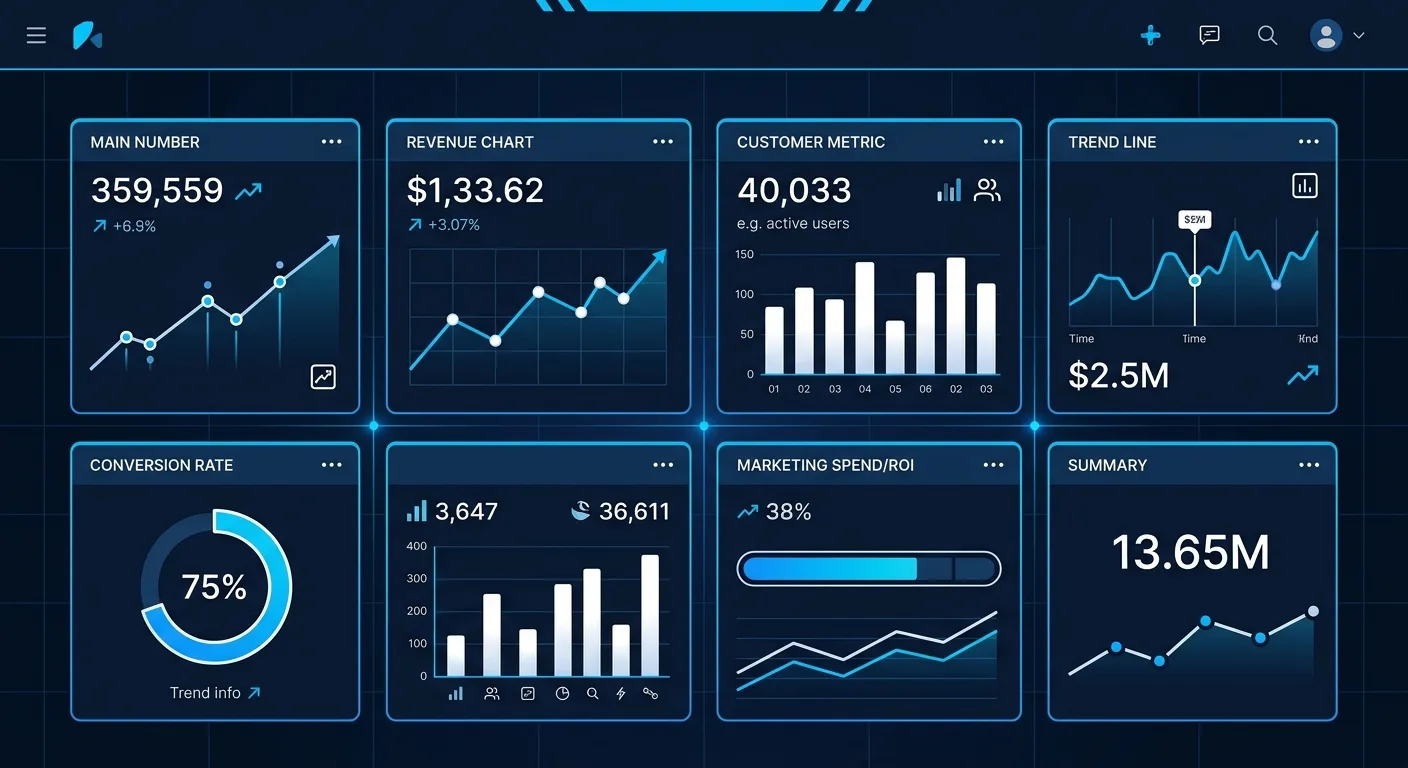
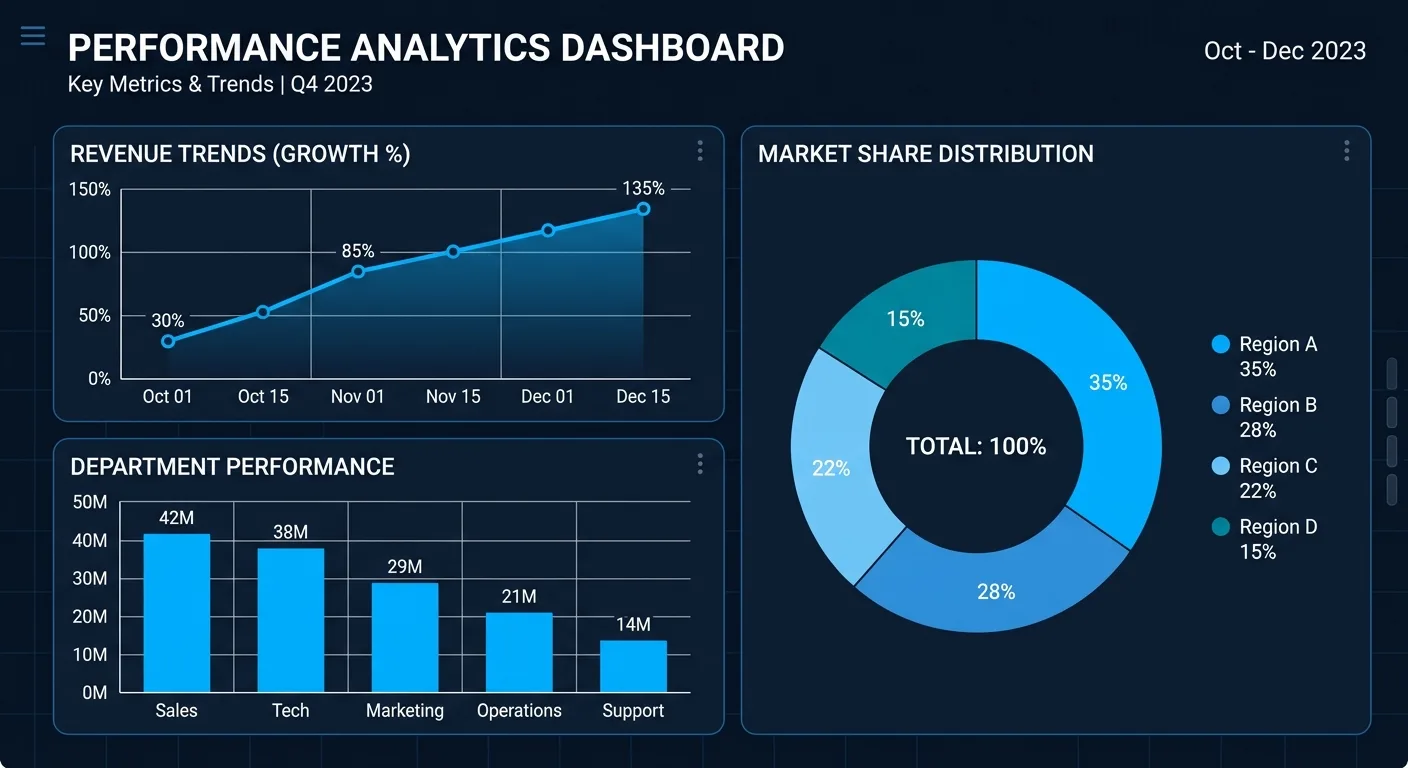
By the end of this guide, you'll have a working web-based dashboard that pulls data from your various business sources, normalizes it, and displays your key metrics in one place. You'll be able to query it with plain English. Something like "show me revenue vs. ad spend for the last 90 days" and get an actual answer.
We're going to use Claude Code as our AI-powered development environment. Think of it as a senior developer who works inside your terminal and can write, edit, and run code on your behalf. The difference between this and just chatting with an AI is that Claude Code actually touches your file system. It creates real files, runs real commands, and builds real software.
Part 1. Setting up your Mac
Install Homebrew
Open your Terminal app (search "Terminal" in Spotlight). Paste this and hit Enter.
/bin/bash -c "$(curl -fsSL https://raw.githubusercontent.com/Homebrew/install/HEAD/install.sh)"Follow the prompts. This gives you a package manager that makes installing everything else easier.
Install Node.js
Claude Code runs on Node.js. In your terminal, run these two commands one at a time.
brew install node@22 brew link node@22Verify it worked.
node --versionYou should see something like v22.x.x or higher. Anything v18 or above is fine.
Install Claude Code
Now install Claude Code globally.
npm install -g @anthropic-ai/claude-codeYou'll need an Anthropic API key. Go to console.anthropic.com, create an account if you don't have one, and generate an API key. You can also use Claude Code with a Max subscription by running claude and choosing to authenticate with your Claude account.
Create your project folder
mkdir kpi-dashboard cd kpi-dashboardNow launch Claude Code inside that folder.
claudeYou're in. You should see Claude's interactive prompt waiting for your instructions.
Part 2. Planning mode and why it matters
Here's where most people go wrong. They jump straight into "build me a dashboard" and end up with a mess. I watched a founder do exactly this. He spent a weekend prompting an AI to build a React app, got something that looked pretty, but couldn't actually connect to any of his real data. He'd skipped the planning step entirely.
Claude Code has a planning mode specifically designed to prevent this. Before writing any code, you use it to think through architecture, data sources, and structure.
Start by typing this into Claude Code.
I want to plan a KPI dashboard project before writing any code. Here's my situation.
My business data lives in these places:
- Revenue and sales: \[Stripe / Shopify / Square\]
- Marketing spend: \[Google Ads / Meta Ads\]
- Customer support: \[Zendesk / Intercom\]
- Spreadsheets: \[Google Sheets / Excel files for anything else\]
I want a single web dashboard that pulls all of this together and lets me query it with plain English. I'm the only user for now. Keep the architecture as simple as possible.
Please create a detailed project plan including tech stack, file structure, data schema, and a step-by-step build order. Don't write any code yet.
Replace the bracketed parts with your actual tools. Be specific. If your revenue comes from Stripe and also from invoices you track in a Google Sheet, say that.
Claude will come back with a structured plan. It'll likely suggest something like this, though it adapts to your specific situation.
Suggested architecture:
- Backend: Node.js with Express
- Database: SQLite (simple, no setup, file-based)
- Frontend: Next.js with Recharts for visualization
- Data connectors: One Python or Node script per data source
- Query engine: Claude API for natural language to SQL translation
- Scheduler: cron job or node-cron for automatic data refreshes
Read the plan carefully. Push back on anything that seems too complex. You can say things like "I don't need authentication for now, it's just for me" or "Can we use SQLite instead of Postgres to keep it simple?" This back-and-forth is the whole point of planning mode.
Part 3. Defining your KPIs
Before you build anything, you need to know what you're measuring. This sounds obvious but I've seen teams build elaborate dashboards that track 47 metrics and nobody looks at any of them.
A good starting set for most businesses looks something like this.
- Revenue. Daily, weekly, monthly totals and trends
- Customer acquisition cost (CAC). Total marketing spend divided by new customers
- Burn rate or operating costs. What you're spending to keep the lights on
- Gross margin. Revenue minus cost of goods sold
- Active customers. How many people bought or used your product recently
- Support ticket volume and resolution time. How happy your customers are
- Conversion rate. Visitors to customers, or leads to closes
Pick 5 to 8 metrics max for your first version. You can always add more later.
Tell Claude Code what you've decided.
Here are my core KPIs for the dashboard. Design the database schema and data pipeline around these:
- Daily revenue (from Stripe)
- Monthly ad spend and CAC (from Google Ads)
- Active customers per week (from Stripe)
- Support tickets opened and avg resolution time (from Zendesk)
- Gross margin (revenue from Stripe minus COGS from my Google Sheet)
- Conversion rate (from Google Analytics)
Create the SQLite schema for storing this data with proper timestamps so I can query any time range.
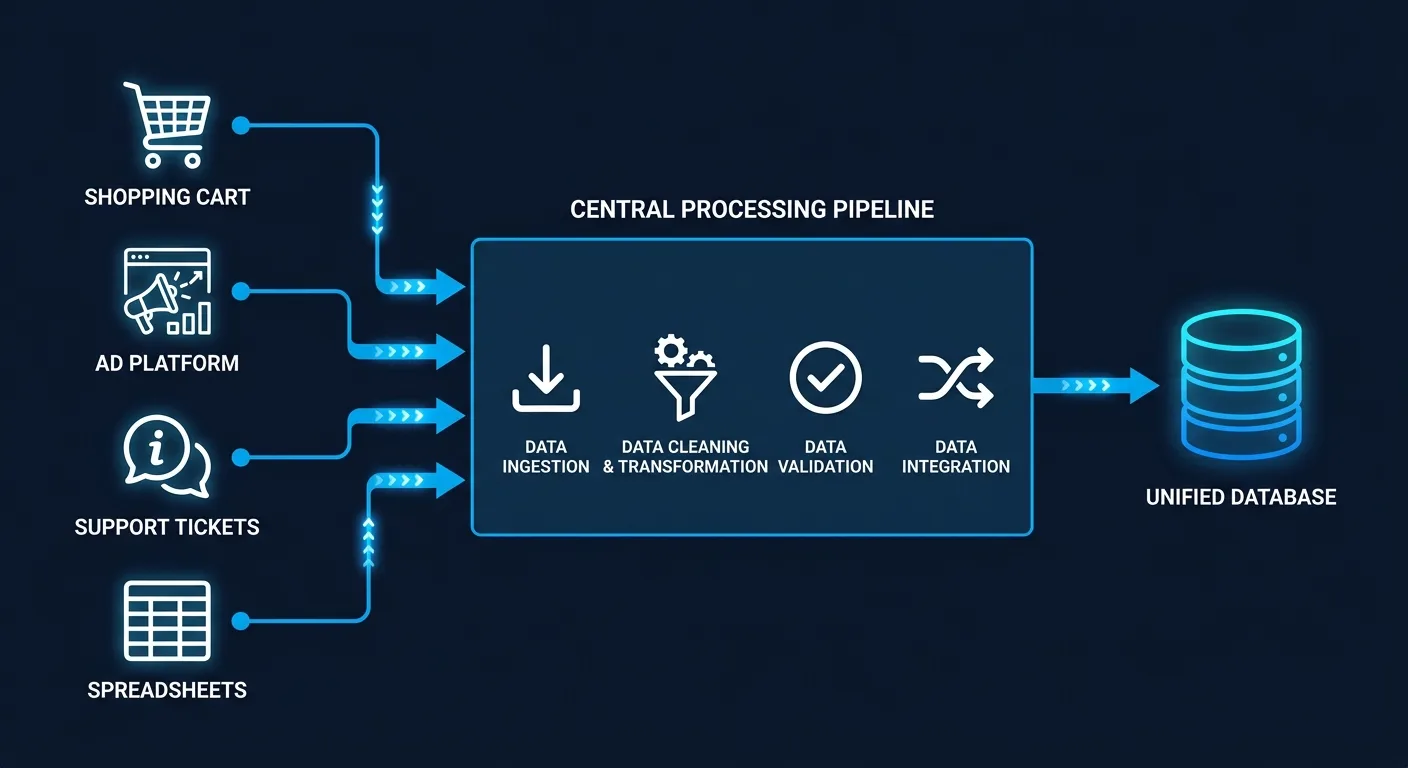
Part 4. Using subagents to build in parallel
This is where things get interesting. Claude Code supports subagents, which are specialized AI workers that handle specific parts of your project. Think of them as a small development team. One handles the database, another builds the API connectors, another works on the frontend.
Here's the prompt to kick this off.
Now I want you to build the project using subagents. Break the work into these parallel tracks and use a separate subagent for each:


Subagent 1 - Database Layer: Set up the SQLite database, create all tables from the schema we planned, and write the data insertion functions.


Subagent 2 - Data Connectors: Build a separate connector module for each data source (Stripe, Google Ads, Zendesk, Google Sheets). Each connector should fetch data and normalize it into the format our database expects.


Subagent 3 - Backend API: Create an Express.js API server with endpoints for each KPI. Include an endpoint that accepts a natural language question and returns a response using the Claude API for SQL generation.


Subagent 4 - Frontend Dashboard: Build a Next.js frontend with cards for each KPI, charts showing trends over time, and a query bar at the top where I can type questions in plain English.


Coordinate these subagents so their outputs are compatible. Start building.
Claude Code will work through each of these, creating files and folders in your project directory. You'll see it writing code in real time. It'll ask you questions along the way, like "Do you want me to use your Stripe test API key or production?" Always start with test/sandbox credentials.
Part 5. Working with agent teams (the orchestration layer)
A guy I know at a logistics company tried this approach but with a twist. He didn't just use subagents for building. He set up what he called "agent teams" where one agent acted as a project manager, reviewing the output of the other agents and flagging issues.
You can do the same thing. After your subagents have produced their initial code, use this prompt.
Now I want you to act as a senior code reviewer. Review all the code that was just generated across every file in this project. Check for:
- Compatibility between the database layer and the connectors. Are they using the same column names and data types?
- API endpoints that match what the frontend expects.
- Error handling. What happens if an API call to Stripe fails?
- Unit consistency. Are all monetary values in the same unit (dollars vs cents)? Are dates in the same timezone?
- Security basics. Are API keys properly loaded from .env and never hardcoded?
List every issue you find, then fix them one by one.
This review step catches problems early. In my friend's case, it found that the Stripe connector was storing amounts in cents while the frontend was displaying them as dollars. A small bug that would have made every revenue number look 100x too high.
Part 6. Setting up your data connections
For the API connectors to work, you'll need API keys from each service. Here's the quick rundown.
Stripe. Go to dashboard.stripe.com/apikeys. Copy your Secret Key. For testing, use the key that starts with sk_test_.
Google Ads. This one's more involved. You need a Google Ads API developer token from ads.google.com/aw/apicenter. You'll also need OAuth2 credentials from the Google Cloud Console. Tell Claude Code "walk me through setting up Google Ads API authentication step by step" and it'll guide you.
Zendesk. Go to your Zendesk admin panel, then Apps and Integrations, then Zendesk API. Generate a token.
Store these in a .env file in your project root. Tell Claude Code to do this for you.
Create a .env.example file with placeholders for all the API keys this project needs. Include comments explaining where to get each key. Then create the actual .env file (gitignored) with the same structure.Then open the .env file in any text editor and paste in your real keys.
Part 7. If you don't have APIs (the spreadsheet path)
Not everything has a nice API. Maybe your financial data lives in QuickBooks exports. Maybe your ops metrics are in Google Sheets that someone updates manually every Friday.
That's fine. Use this prompt.
Some of my data doesn't come from APIs. I need you to build CSV and Google Sheets importers.


For CSV: Create a /data/imports folder. Build a script that watches this folder and automatically imports any new CSV files into the right database tables. The script should be smart enough to detect which KPI the CSV relates to based on column headers.


For Google Sheets: Connect to this specific sheet \[paste your Google Sheet URL\] and pull data from the tabs called "COGS" and "Monthly Expenses." Set it up to refresh every 6 hours.


Handle messy data gracefully. Skip blank rows, handle inconsistent date formats, and log warnings instead of crashing on bad data.
This is actually how most real businesses start. Perfectly clean API integrations are the exception, not the rule. One founder I spoke with ran her entire 50-person company's reporting off a combination of three APIs and seven spreadsheet imports. It wasn't elegant, but it worked. And "it works" beats "it's architecturally pure" every single time.
Part 8. Building the natural language query layer
This is the part that makes the whole thing feel like magic. Instead of writing SQL or clicking through filters, you just ask a question.
Build the natural language query feature. Here's how it should work:
- User types a question in the search bar, like "What was our revenue last month?" or "Compare CAC across the last 4 quarters."
- The backend sends the question to Claude's API along with the full database schema (table names, column names, data types, and example values for each column).
- Claude generates a SQL query.
- The system runs that SQL against the SQLite database.
- The results are sent back to Claude with the original question to generate a human-readable response.
- The frontend displays both the text answer and an auto-generated chart if the data is time-series or comparative.
Use the Anthropic SDK. The model should be claude-sonnet-4-20250514. Include error handling for cases where the generated SQL is invalid.
Under the hood, this works by sending your question to Claude's API along with your database schema. Claude figures out the right SQL query, the system runs it, and the results come back in plain language. It's not conceptually complicated. But it's incredibly useful when you're in a meeting and someone asks "what's our cost per acquisition trending at?" and you can just type the question and have an answer in seconds.

Part 9. Running and testing everything
Time to see if it actually works. Use this prompt.
Let's test the entire system end to end. Do this in order:
- Run the database migration to create all tables
- Run each data connector once and show me the output
- Verify data landed in the database by querying each table
- Start the backend server
- Start the frontend dev server
- Open the dashboard in my browser
If anything fails, diagnose the error, fix it, and continue to the next step. Don't stop at the first error.
Claude Code will run each step in your terminal. When something breaks (and something will break, that's just how software works), it'll diagnose the error and propose a fix. You approve it, it applies the fix, and moves on.
For sample data during testing, you can ask Claude Code to generate some.
Generate 6 months of realistic sample data for all my KPI tables. Make the numbers plausible for a small e-commerce business doing about $50K/month in revenue. Include some seasonal variation and a slight upward growth trend. Insert it all into the database so I can test the dashboard with real-looking data.Part 10. Scheduling automatic data refreshes
A dashboard that only shows data when you manually run import scripts isn't very useful. Let's automate it.
Set up automatic data refreshes using node-cron in the backend server.
- Stripe data: refresh every 4 hours
- Google Ads data: refresh once daily at 6 AM
- Zendesk data: refresh every 2 hours
- Google Sheets data: refresh every 6 hours
Log each refresh with a timestamp and success/failure status. Add a small "Last updated" indicator on each dashboard card showing when that data source was last refreshed.
Also create a manual "Refresh Now" button on the dashboard that triggers all connectors at once.
If you want something more robust, you can ask Claude Code to set up a simple job queue. But for a single-user dashboard, node-cron running inside your backend server works perfectly fine.
Part 11. Making it look good
The default output from Claude Code will be functional but probably ugly. That's normal. Once everything works, spend a few minutes on polish.
Improve the dashboard UI. I want:
- Clean, minimal design with lots of white space
- A dark/light mode toggle
- KPI cards at the top showing current values with a small green/red indicator showing the change from the previous period
- Larger chart area below the cards, defaulting to a revenue trend line
- The natural language query bar fixed at the top of the page
- Responsive layout that works on my phone too
- Use a clean sans-serif font like Inter
Keep it simple. No animations, no gradients, no unnecessary decoration. Think "Stripe dashboard" level of clean.
Don't over-design on the first pass. Get the layout right and make the numbers readable. You can always refine the aesthetics later.
Part 12. Real-world example from start to finish
Let me tell you how this played out for an actual small business. My neighbor runs a chain of three coffee shops. His data situation was a mess. Sales came from Square POS. Inventory was tracked in a shared Google Sheet. Employee hours were in Homebase. Marketing was "whatever we post on Instagram" with no real spend tracking.
We sat down on a Saturday morning and followed this exact process. His KPIs were simple.
- Daily revenue per location (from Square)
- Labor cost as a percentage of revenue (from Homebase and Square)
- Inventory waste rate (from his Google Sheet where baristas log discarded items)
- Average transaction value (from Square)
- Week-over-week revenue growth (calculated from the data above)
We used Square's API, the Google Sheets API for inventory and waste tracking, and Homebase's API for labor data. The whole build took about four hours, including two coffee breaks and one moment where we realized the Google Sheets connector was pulling from the wrong tab.
The following Monday, instead of his manager spending 45 minutes pulling numbers from three different apps, everything was just there. One screen. Updated automatically. His exact words were "Why didn't I do this two years ago?"
The answer, of course, is that two years ago this would have cost $15,000 and taken a freelance developer two months. Today it costs roughly $20 in API calls and an afternoon of your time.
Common problems and how to fix them
"Claude Code says it can't access that API." Usually means your API key is wrong or not set in the .env file. Double-check credentials. Also make sure you've installed any required packages by asking Claude Code to run the install commands.
"The dashboard loads but shows no data." Run the import scripts manually first and check if data is actually in the SQLite database. Ask Claude Code to "query the revenue table and show me the last 10 rows" to verify.
"Charts are rendering but the numbers look wrong." 90% of the time this is a unit mismatch. Cents vs. dollars. Daily vs. monthly totals being compared. Ask Claude Code to "audit the data pipeline for unit consistency from source to display."
"The natural language queries give bad answers." This usually means the schema description being passed to the Claude API isn't detailed enough. Ask Claude Code to "improve the schema description sent to the query engine, adding column descriptions and example values for each table."
"Everything broke after I changed something." That's what git is for. At the beginning of the project, ask Claude Code to "initialize a git repository and commit the initial working version." Then commit after each major milestone. You can always roll back.
Where to go from here
Once your basic dashboard is working, you'll immediately start thinking of additions. Here are some natural next steps.
Alerts. "Notify me if daily revenue drops below $X." Ask Claude Code to add an alerting system that sends you a Slack message or email when a KPI crosses a threshold you set.
Forecasting. "Based on the last 6 months, where are we headed?" You can add a simple linear regression model. Ask Claude Code to "add a forecasting feature using basic time series analysis on my revenue data."
Team access. If others need to see the dashboard, ask Claude Code to "add basic password authentication and deploy this to a cloud server using Railway or Fly.io." It'll walk you through the whole deployment.
More data sources. Each new integration follows the same pattern. Build a connector, normalize the data, insert it into the database, add a card or chart to the frontend.
The bigger picture
The real value here isn't the dashboard itself. It's the fact that your business data is now unified in a single database that you can query however you want. That's the foundation for every smart decision you'll make going forward.
Before tools like Claude Code existed, building something like this required hiring a developer or paying for expensive BI platforms like Tableau or Looker. Today's enterprise AI stack has changed that equation. Those tools are great, but they're overkill for a business that just needs to see its numbers in one place.
If you're a business leader trying to figure out where AI fits into your operations, a project like this is one of the best places to start. It's concrete, it delivers value in a single afternoon, and it gives you firsthand experience working with AI agents. And if you want guidance on rolling out AI across your organization more broadly, that's exactly the kind of thing a fractional Chief AI Officer can help with, scoping projects like this, building the business case, and making sure you're not just experimenting but actually shipping.
The approach in this guide gives you something those platforms don't. Total control over your data, no monthly subscription, and the ability to extend it in any direction using plain English instructions.
Start with the basics. Get your numbers on one screen. Then iterate from there.
Frequently Asked Questions
For a single-user dashboard, your main cost is the Anthropic API key for Claude Code and natural language queries. Expect $10-30 during the build and $5-15 per month for ongoing API calls. The software stack (Node.js, SQLite, Next.js) is free and open source. Compare that to Tableau ($70/user/month), Looker ($5,000+/month), or hiring a freelance developer ($5,000-15,000 for a custom dashboard).
For a single-user dashboard like the one in this guide, your main cost is the Anthropic API key for Claude Code and the natural language query feature. Expect to spend $10-30 during the build process and $5-15 per month on ongoing API calls for queries and data processing. The software itself (Node.js, SQLite, Next.js) is all free and open source. Compare that to Tableau at $70 per user per month, Looker at $5,000+ per month, or hiring a freelance developer for $5,000-15,000 for a custom dashboard.
No. Claude Code acts as your development environment where you describe what you want in plain English and it writes, runs, and debugs the code. You need to be comfortable using a terminal (typing commands and pressing Enter), but you do not need to understand the code being generated. Having a general sense of what is happening helps you ask better questions and catch problems faster.
No. That is the entire point of using Claude Code as your development environment. You describe what you want in plain English, and it writes, runs, and debugs the code for you. You need to be comfortable using a terminal (typing commands and hitting Enter), but you do not need to understand the code being generated. That said, having a general sense of what is happening helps you ask better questions and catch problems faster.
CSV imports and Google Sheets connections cover most situations where a proper API does not exist. If your data lives in Excel files, PDFs, or email reports, Claude Code can build importers for those formats. Many real dashboards pull from a mix of APIs, Google Sheets, and CSV exports. It is not architecturally elegant, but it works.
CSV imports and Google Sheets connections cover most situations where a proper API does not exist. If your data lives in Excel files, PDFs, or email reports, Claude Code can build importers for those formats too. I have seen dashboards that pull from a mix of three APIs, two Google Sheets, and a folder of CSV exports from QuickBooks. It is not architecturally elegant, but it works and delivers the same end result.
The most common issues are API credential expirations, data source schema changes (like a column getting renamed in a Google Sheet), and dependency updates that introduce incompatibilities. Open Claude Code in your project folder and describe the problem. Keep your git repository up to date so you can always roll back to a working version.
For straightforward questions like 'what was revenue last month' or 'show me CAC trend over 6 months,' accuracy is high, around 90-95% of well-formed questions produce correct SQL and accurate results. It struggles more with ambiguous questions or metrics that require complex joins across multiple tables. The fix is improving the schema descriptions you pass to the Claude API. The more context you give the model about what each column means and how tables relate, the better the queries get.
The version in this guide runs locally on your Mac. To share it, deploy it to a server using Railway, Fly.io, or a basic VPS for $5-20 per month. You would also want to add password protection before exposing it. Ask Claude Code to add basic authentication and deploy, and it handles most of the setup. For teams of 2-5 people, this is usually more than enough.
The version in this guide runs locally on your Mac. To share it, you would need to deploy it to a server. Claude Code can walk you through deploying to Railway, Fly.io, or a basic VPS for $5-20 per month. You would also want to add password protection before exposing it to the internet. For teams of 2-5 people at a small company, this setup is usually more than enough.
For straightforward questions like asking about revenue last month or CAC trends over 6 months, accuracy runs around 90-95%. The system struggles more with ambiguous questions or metrics requiring complex joins across multiple tables. Improving the schema descriptions you pass to the Claude API fixes most accuracy issues. The more context you give the model about columns and table relationships, the better the queries get.
Software breaks. The most common issues are API credential expirations, data source schema changes (like a column getting renamed in your Google Sheet), and dependency updates that introduce incompatibilities. When something breaks, open Claude Code in your project folder and describe the problem. Something like 'the Stripe connector stopped working yesterday' is usually enough for it to diagnose the issue and fix it. Keep your git repository up to date so you can always roll back to a working version.